Which web hosting is better?


Top 10 Web Hosting For The Last 3 Years
| # | Provider | HRANK | Uptime, % | Response, ms | Shared IPs | Sites |
|---|---|---|---|---|---|---|
| 1 | SiteGround.com | 9.5 | 99.990 | 596 | 2,100 | 696,505 |
| 2 | One.com | 9.1 | 99.985 | 755 | 438 | 315,860 |
| 3 | Yahoo.com | 9.1 | 99.968 | 406 | 4 | 2,484 |
| 4 | Names.co.uk | 9.0 | 99.978 | 716 | 20 | 15,600 |
| 5 | BlueDomino.com | 8.8 | 98.066 | 542 | 1 | 762 |
| 6 | BlackNight.com | 8.7 | 99.978 | 822 | 12 | 17,496 |
| 7 | WebzPro.com | 8.7 | 94.465 | 550 | 1 | 513 |
| 8 | 1and1.com | 8.5 | 99.979 | 545 | 555 | 101,116 |
| 9 | HostMonster.com | 8.3 | 99.961 | 754 | 126 | 99,250 |
| 10 | HostForWeb.com | 8.3 | 99.950 | 750 | 3 | 1,128 |
The data presented in the table is from 2019 year till now. The values for HRank, Uptime, and Response time are average for this time period; the number of Shared IPs and Sites are valid for today. For more details look at the whole table.
Are Most Popular Web Hostings so Reliable?
The request for Most Popular Web Hostings revealed a number of names that tended to repeat from one review site to another. As a matter of fact, these providers for some reason or other got a lot more publicity than others, usually, thanks to clever promotional and marketing campaigns. Yet, as it turns out, some of them are not so good as they claim to be.
We analyzed 5 major review hosting websites, compared the results with our monitoring data for 2019-2021 (read: what is HRank).
| Hosting Provider | # in TOP | HRANK | Uptime | Response |
|---|---|---|---|---|
| SiteGround | #1 | 9.5 | 99.990 | 594 |
| GreenGeeks | #12 | 8.1 | 99.972 | 953 |
| Bluehost | #28 | 7.3 | 99.951 | 1361 |
| HostGator | #68 | 6.1 | 99.912 | 1180 |
| DreamHost | #90 | 5.5 | 99.877 | 429 |
Notice: UPTIME makes 80% of our rating!
The same can not be referred to the review websites we analyzed. Most of them simply provide a compiled set of information, a short sum-up or a very detailed review, based on what was gathered on other resources, or they draw their conclusions on the basis of subjective hosting performance results (i.e. evaluate the performance of one (or several) particular domains via some popular website monitoring tool).
Only one provider from the 5 most popular web hosting companies appeared on our TOP 10: SiteGround (#1)!
GreenGeeks (#12) is also in the green zone (HRank 8.0 – 10.0).
Interestingly enough, most other popular providers in the review websites appeared somewhere in the range of 5.0 – 8.0 HRank, the result that speaks very eloquently about their actual performance.
DreamHost (only #90) is mentioned everywhere on various review sites and our robot can see that it hosts more than 1 million websites;
Yet, we are constantly having trouble accessing their hosted websites, which eventually negatively affects the overall rating of the providers.
All in all, though many users and the aforementioned review websites might not agree with us in our approach to these comparisons, it has been provided as food for reflection and an alternative opinion.
However, we don’t aim to either promote or depreciate any hosting provider as it doesn’t have any affiliation to either of them; rather, we strive to provide website owners with another, more objective, angle to look at the provider’s performance. So, choose wisely or read our guide “How to Find Your Web Hosting Provider“.
What We Know About the Shared Web Hosting Market
We’ve been monitoring 90% of the shared web hosting market since the middle of 2018 and have managed to accumulate quite a lot of interesting information.
The following chart shows daily changes in the number of domains (sites) and shared IPs of all hosting providers on our list (Here a rule that shared hosting is a set of “servers/IPs” with 50 and more domains is applied, and by a “server” we mean an IP where the providers host customers’ websites).
As of November 2019, there are 45,500 shared servers and 16,000,000 domains.
Equally important is the fact that the chart does not include any parked domains or the ones hosted on website builder platforms, also we are planning to exclude cloud servers with a lot of websites on 1 IP.
One can also presuppose that since we exclude the information about the IPs with fewer than 50 domains, we might present not an entirely objective picture. However, this is more the case of VPS, where the number of domains per IP (“server”) is usually lower than the one on shared servers.
If we take the total number of domains from our chart and divide it by the number of shared IPs, we’ll get the average number of domains per 1 IP: 16,000,000 / 45500 = 351, which is respectively more than our 50 domains per 1 IP limit.
For example, the most common situation revealed from our data is when 1 IP hosts about 100-110 domains (this is true for 9,600 IPs out of 39,000 IPs that we know). Consequently, the chosen limit of 50 and more domains can be considered the most accurate in terms of shared hosting market coverage.
Yet, despite the stability revealed with regard to the total number of domains, quantitative changes do take place locally: each provider shows either a tendency to lose or to increase the domain bulk.
How Fast Are Web Hosting Providers?
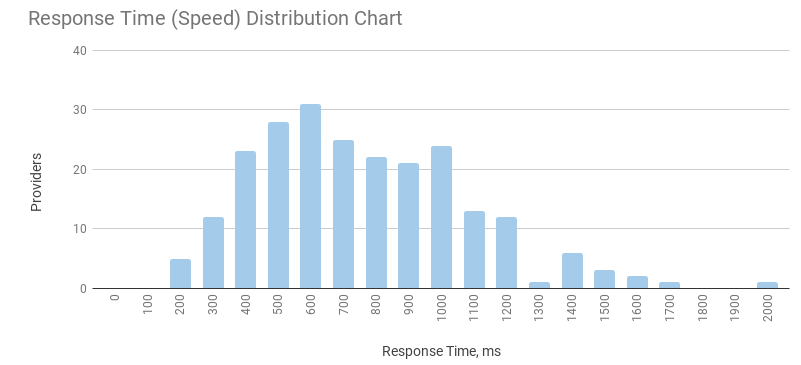
The chart demonstrates providers’ speed and quantity distribution. In our case, we took 230 providers (Jan – Feb 2019) and calculated the average speed of each “server” (Shared IP) and we also calculated the average speed of each hosting provider.
Under the term of speed we mean “get http” request to a website (there is also the definition of TTFB – time to first byte).
Judging by this chart, we can notice that the major bulk of providers is in the 400-1000ms zone. There are very fast providers with the average response time of 200ms, and very slow ones with the response time not faster than 1,000ms; the latter group is comprised of more than 30 providers.
Speed (response time) is one of the factors that influence our HRank rating and that is why the providers faster than 700ms get a higher rate.
100% Uptime, Is It Possible?
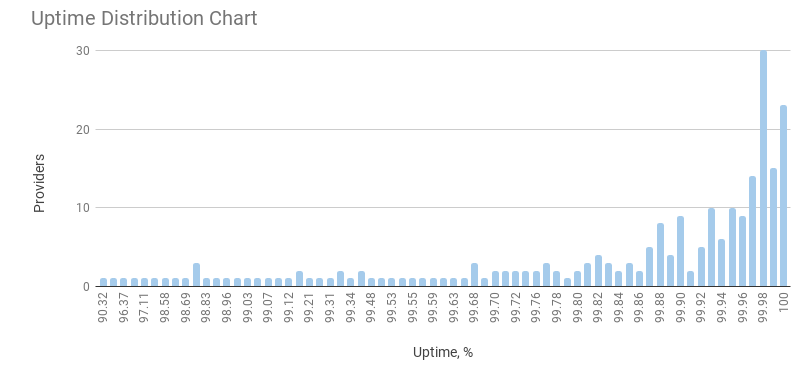
Here, on the chart (February 2019 data), we can see that the main part of the providers is based on the 99.90-100% range.
Only 23 providers have 100% uptime.
Uptime is the major factor that we take into account in our HRank rating, which makes the latter very sensitive to any slight changes in the former.
For example, the difference between 99.92% and 99.96% (if you round up both, they will be 100%) is essential as it may result in several hours of downtime when websites are non-responsive.
We can take FatCow, on 28 Feb 2019 it had 99,991% Uptime (almost 100%), but if we calculate numbers for all “shared servers” (shared IPs) we will get this information:
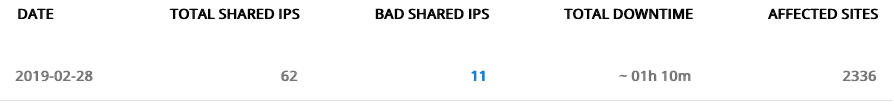
Just only 0,009% downtime is 1 hour and 10 min, sum of all downtimes from 11 Shared IPs when 2336 websites were not working there. That’s why it is so important to measure detailed uptime values.
Companies with the Biggest Uptime Changes for 1 Day
| PROVIDER | *UPTIME, % | **UPTIME CHANGE |
|---|---|---|
| HostPapa.com | 96.557 | -3.423 |
| Dotster.com | 94.139 | -2.875 |
| Domain.com | 98.624 | -0.953 |
| Contabo.com | 98.581 | -0.707 |
| Midphase.com | 99.527 | -0.473 |
| Tsohost.co.uk | 98.799 | -0.436 |
| MyResellerHome.com | 99.572 | -0.428 |
| OVH.com | 99.710 | -0.282 |
| WebHost4Life.com | 99.733 | -0.267 |
| Host4Geeks.com | 99.514 | -0.220 |